Investor Relations
IR
Financial Highlights
Result Outline
| 2021.3 | 2022.3 | 2023.3 | 2024.3 | 2025.3 | |
|---|---|---|---|---|---|
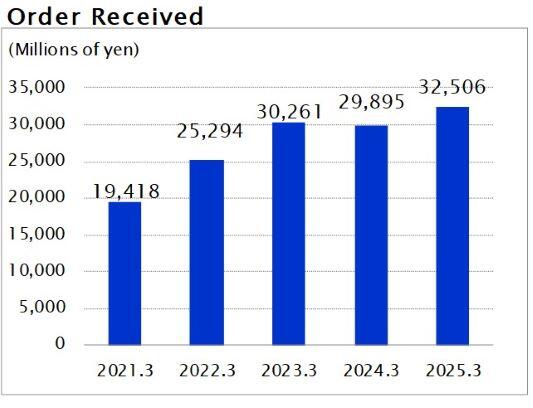
| Orders Received(Millions of yen) | 19,418 | 25,294 | 30,261 | 29,895 | 32,506 |
|
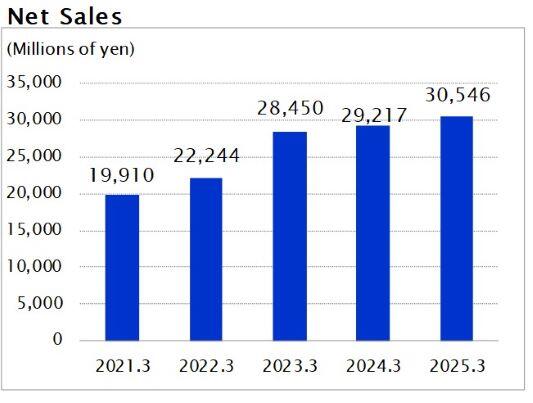
Net Sales (Millions of yen) |
19,910 | 22,244 | 28,450 | 29,217 | 30,546 |
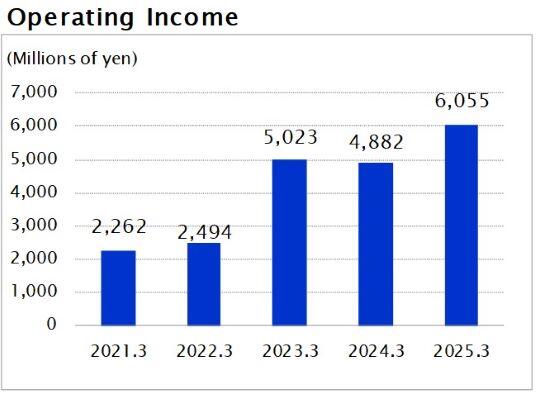
| Operating Income(Millions of yen) | 2,262 | 2,494 | 5,023 | 4,882 | 6,055 |
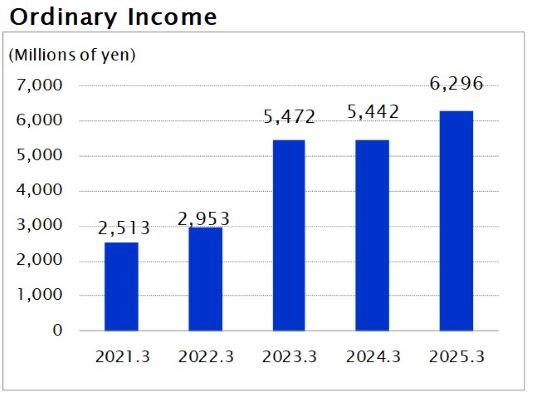
| Ordinary Income(Millions of yen) | 2,513 | 2,953 | 5,472 | 5,442 | 6,296 |
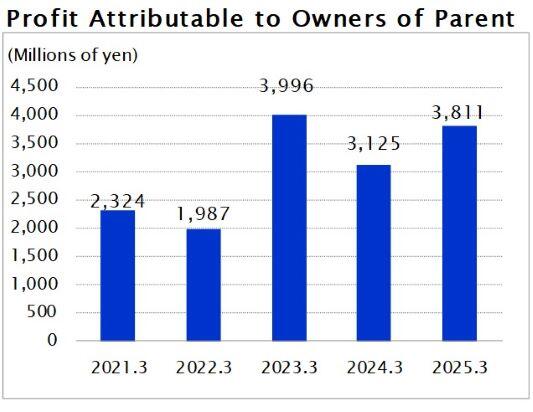
| Profit Attributable to Owners of Parent(Millions of yen) |
2,324 | 1,987 | 3,996 | 3,125 | 3,811 |
| Net Income Per Share(Yen) | 118.08 | 103.29 | 214.95 | 173.81 | 219.27 |
Assets
| 2021.3 | 2022.3 | 2023.3 | 2024.3 | 2025.3 | |
|---|---|---|---|---|---|
|
Total Assets (Millions of yen) |
35,631 | 39,001 | 41,596 | 42,040 | 42,396 |
|
Net Assets (Millions of yen) |
28,834 | 30,291 | 31,506 | 32,466 | 33,504 |
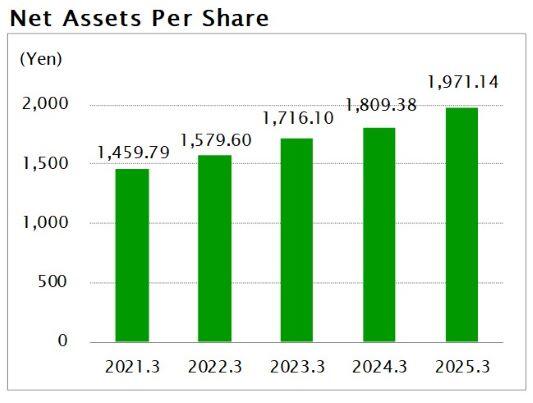
| Net Assets Per Share(Yen) | 1,459.79 | 1,579.60 | 1,716.10 | 1,809.38 | 1,971.14 |
Financial Indicators
| 2021.3 | 2022.3 | 2023.3 | 2024.3 | 2025.3 | |
|---|---|---|---|---|---|
| Return on Assets (%) | 7.1 | 7.9 | 13.6 | 13.0 | 14.9 |
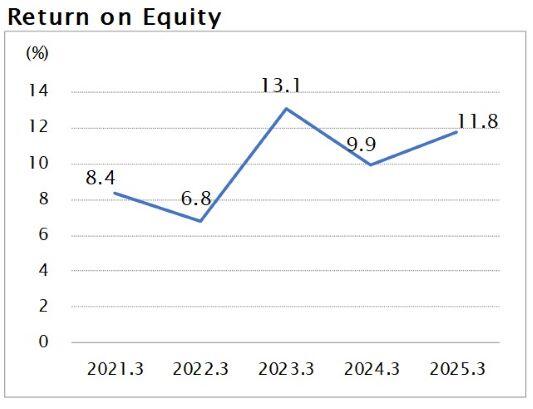
| Return on Equity (%) | 8.4 | 6.8 | 13.1 | 9.9 | 11.8 |
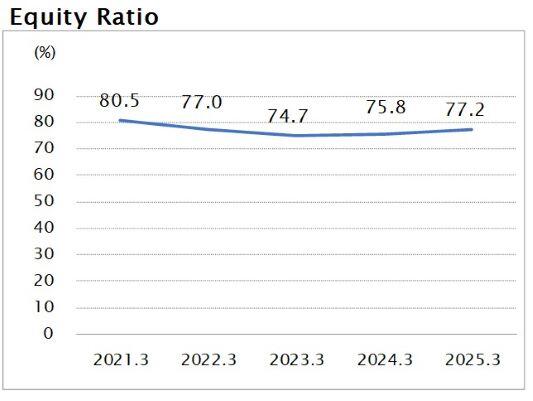
| Equity Ratio (%) | 80.5 | 77.0 | 74.7 | 75.8 | 77.2 |